// spending reports Spending reports that


Spending reports that
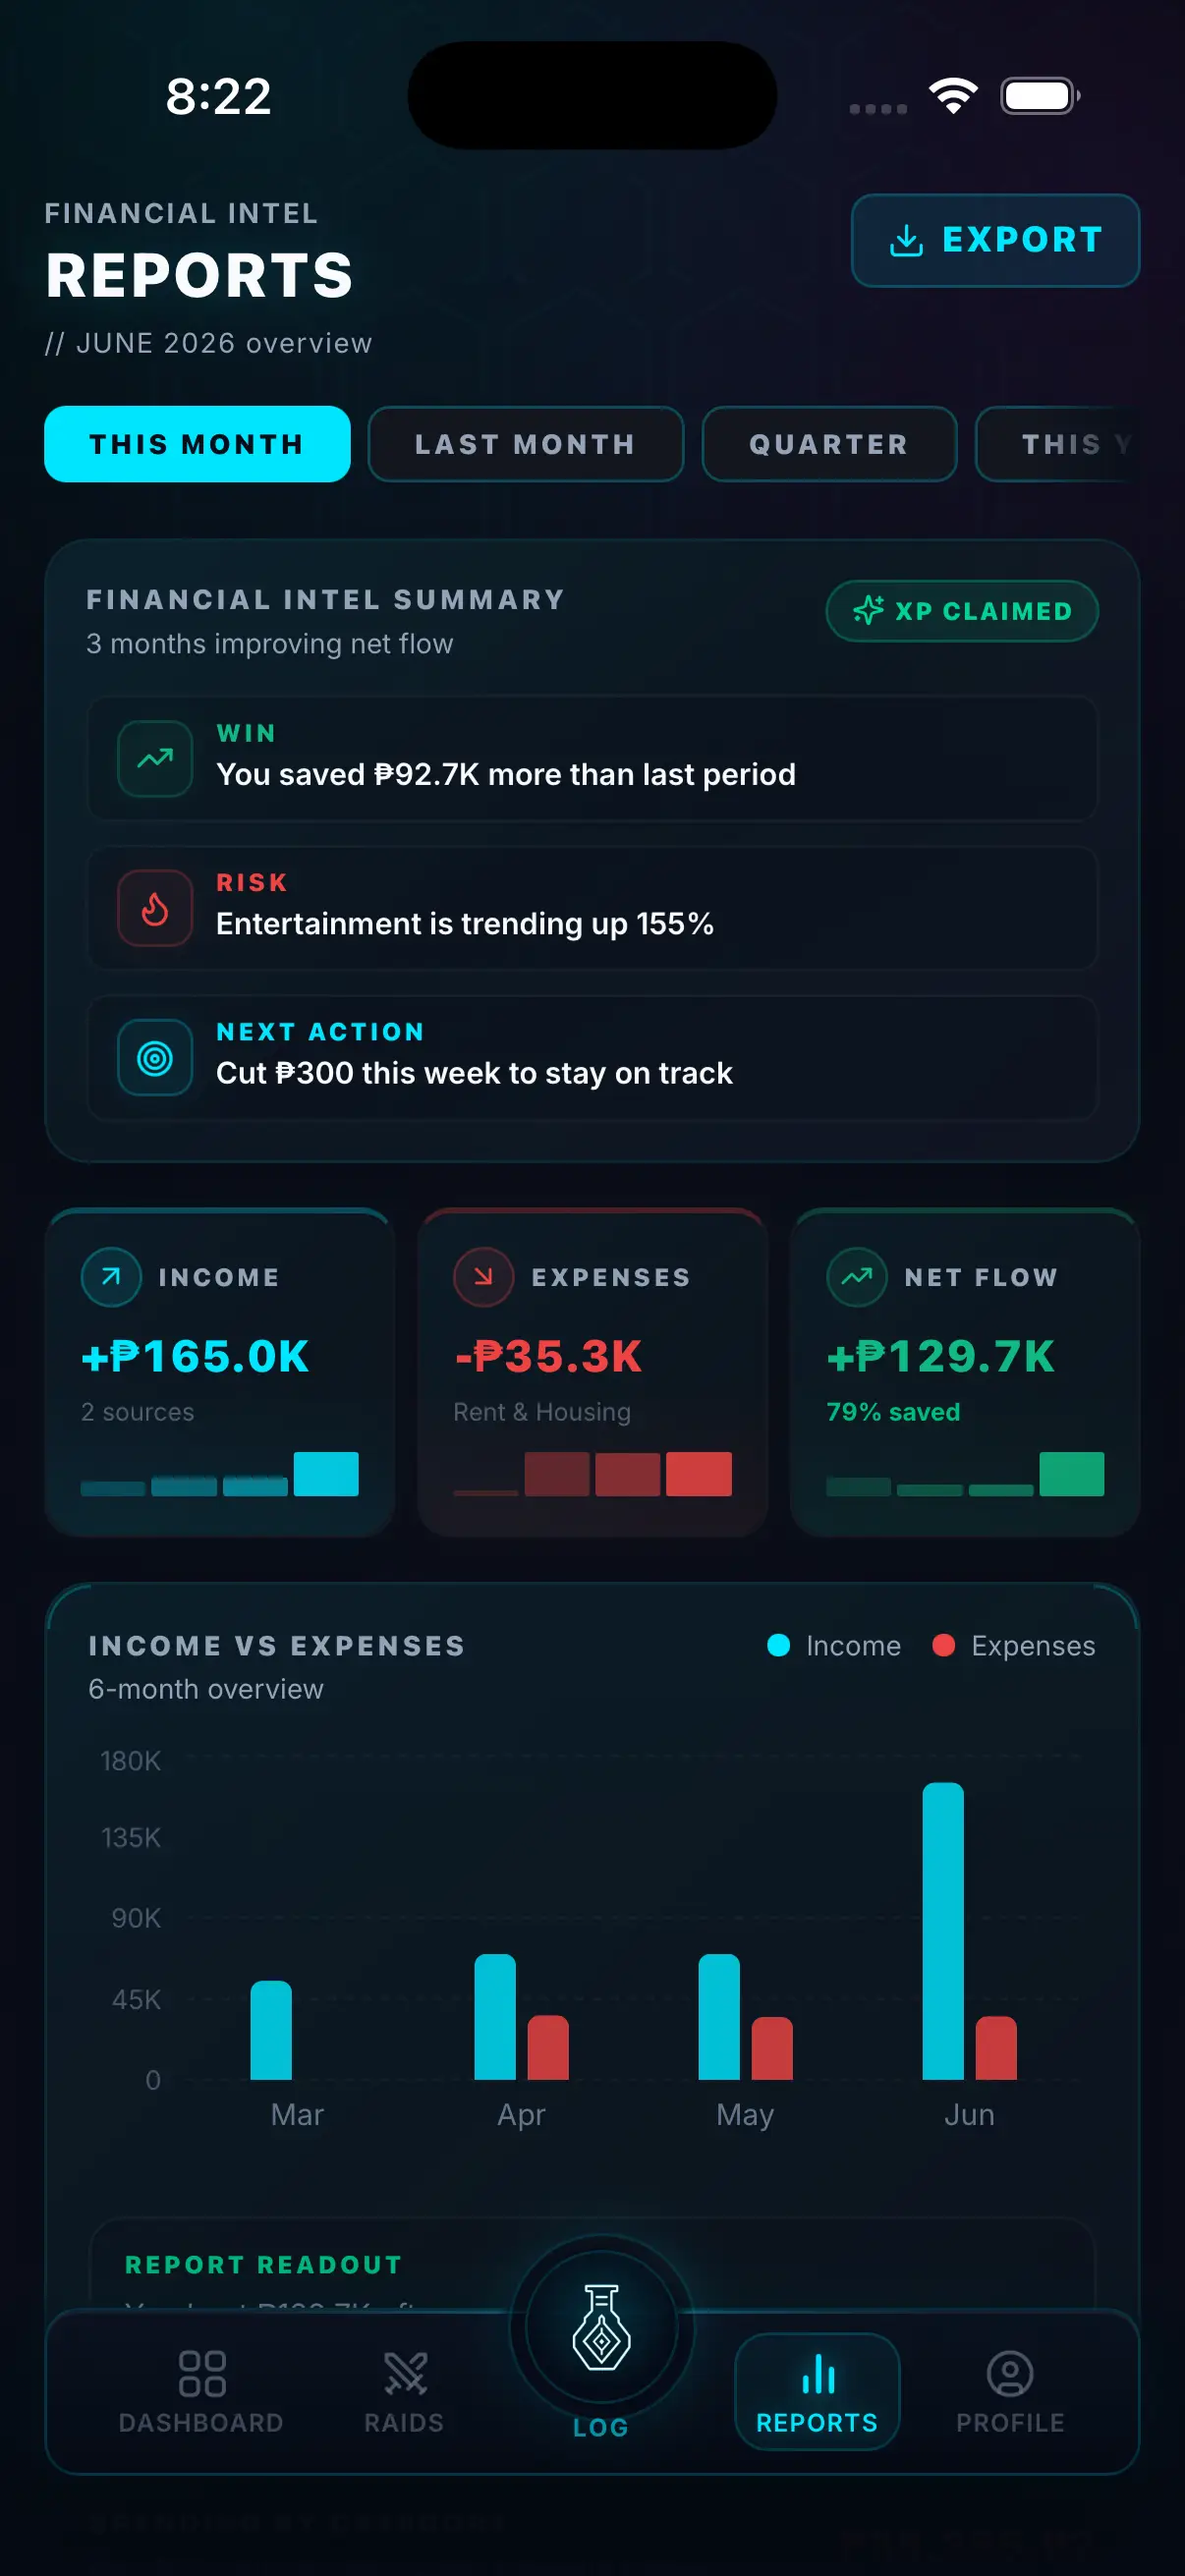
actually make sense
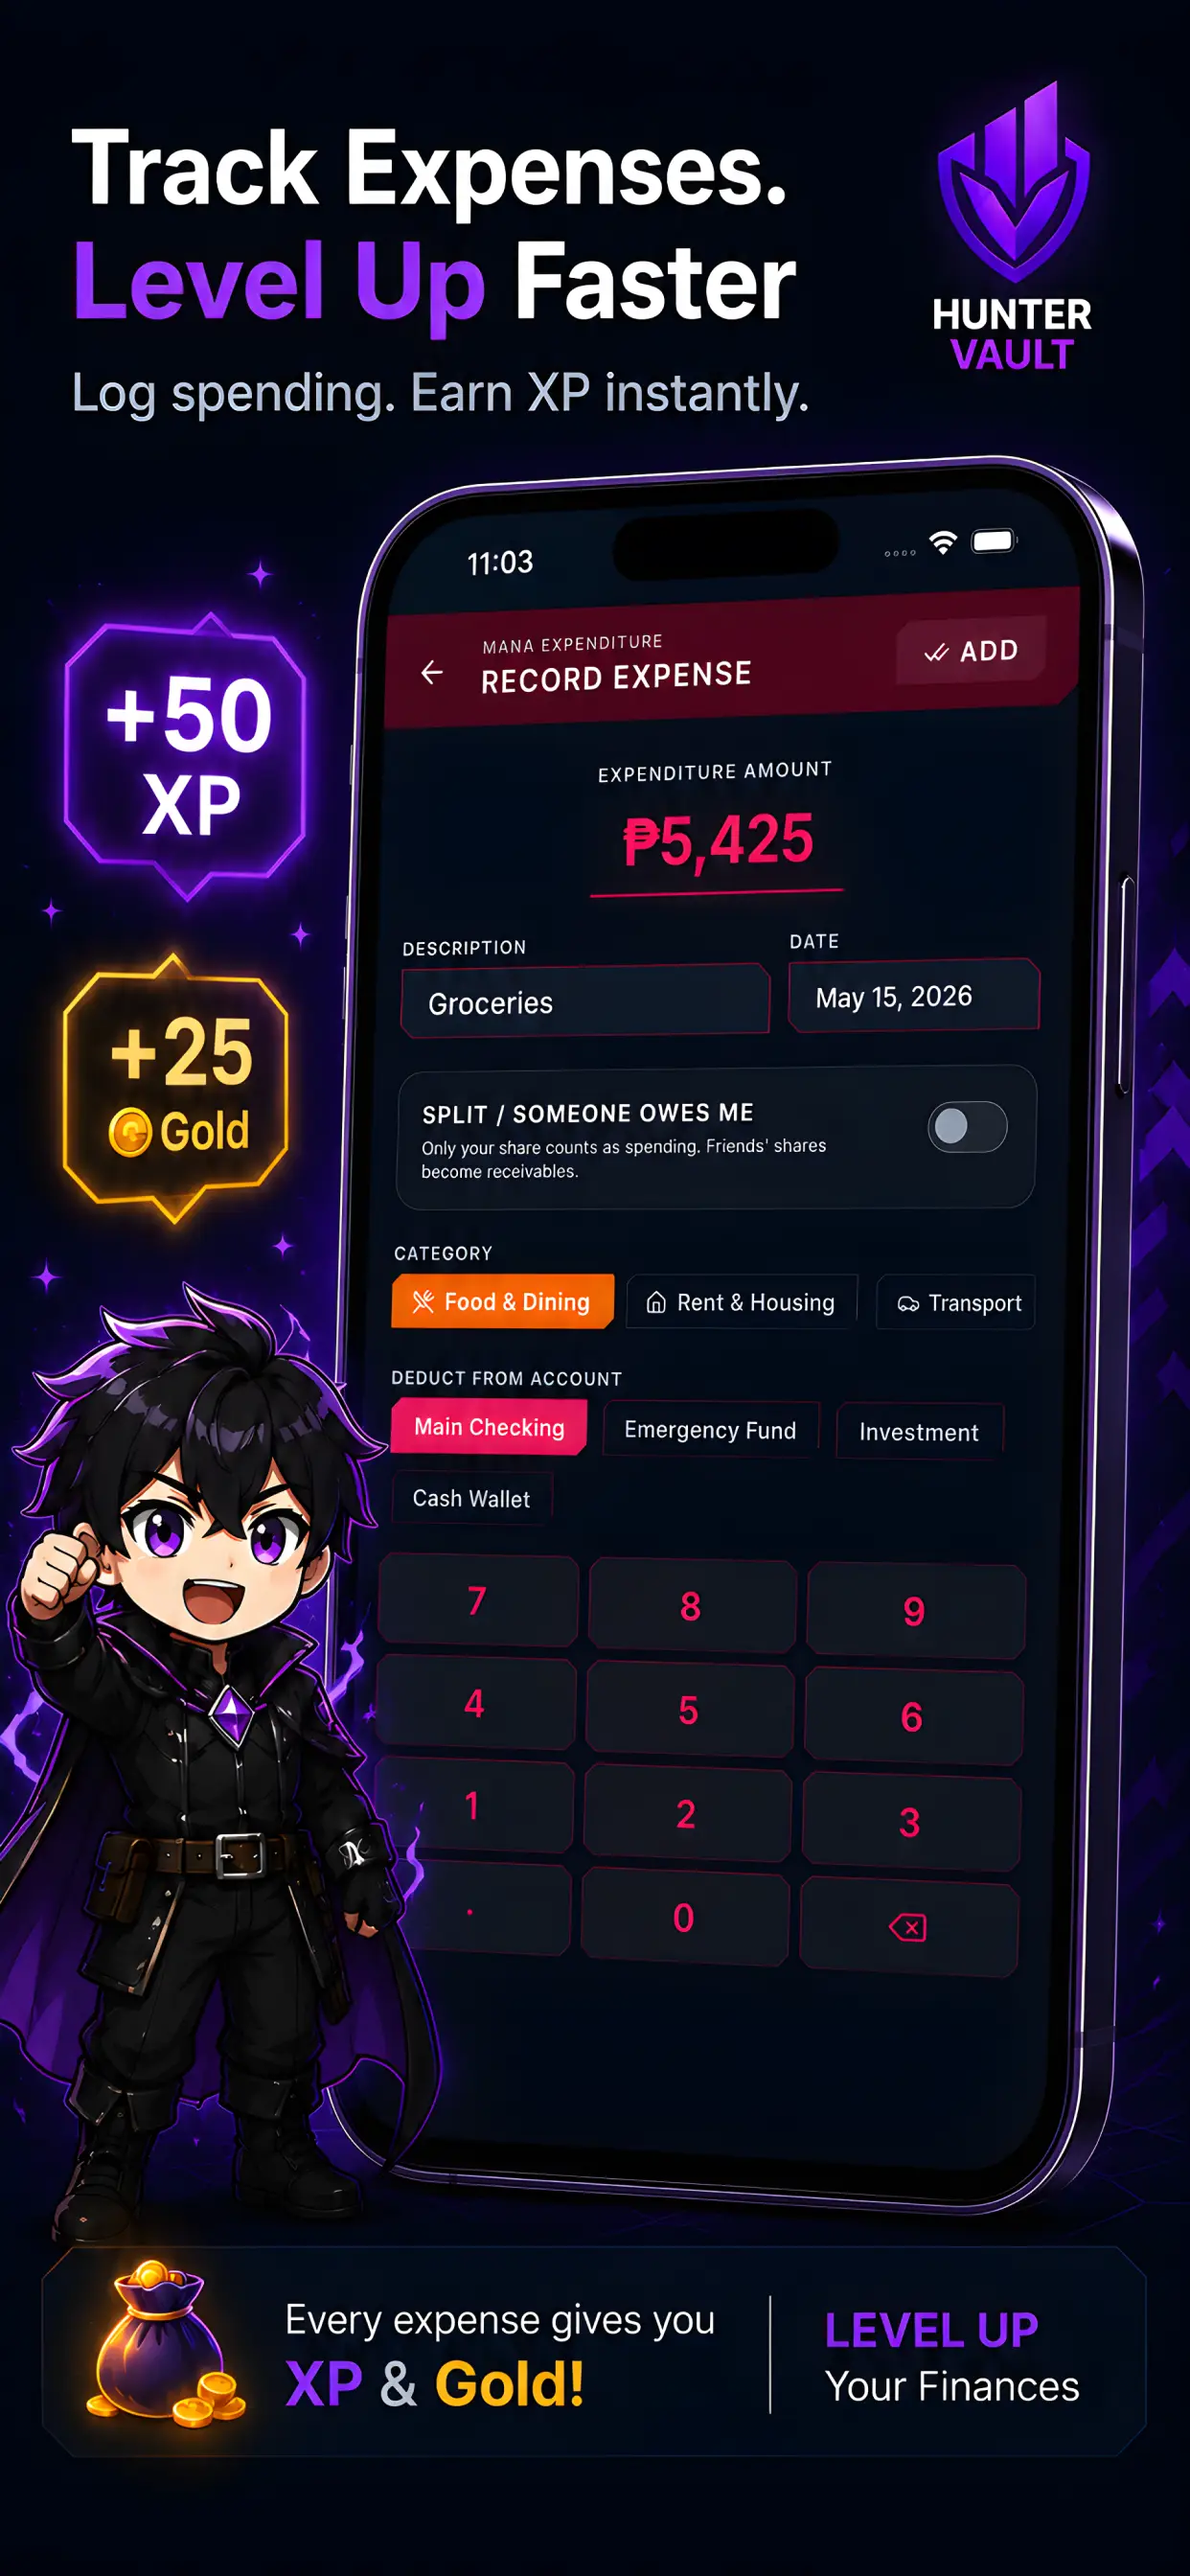
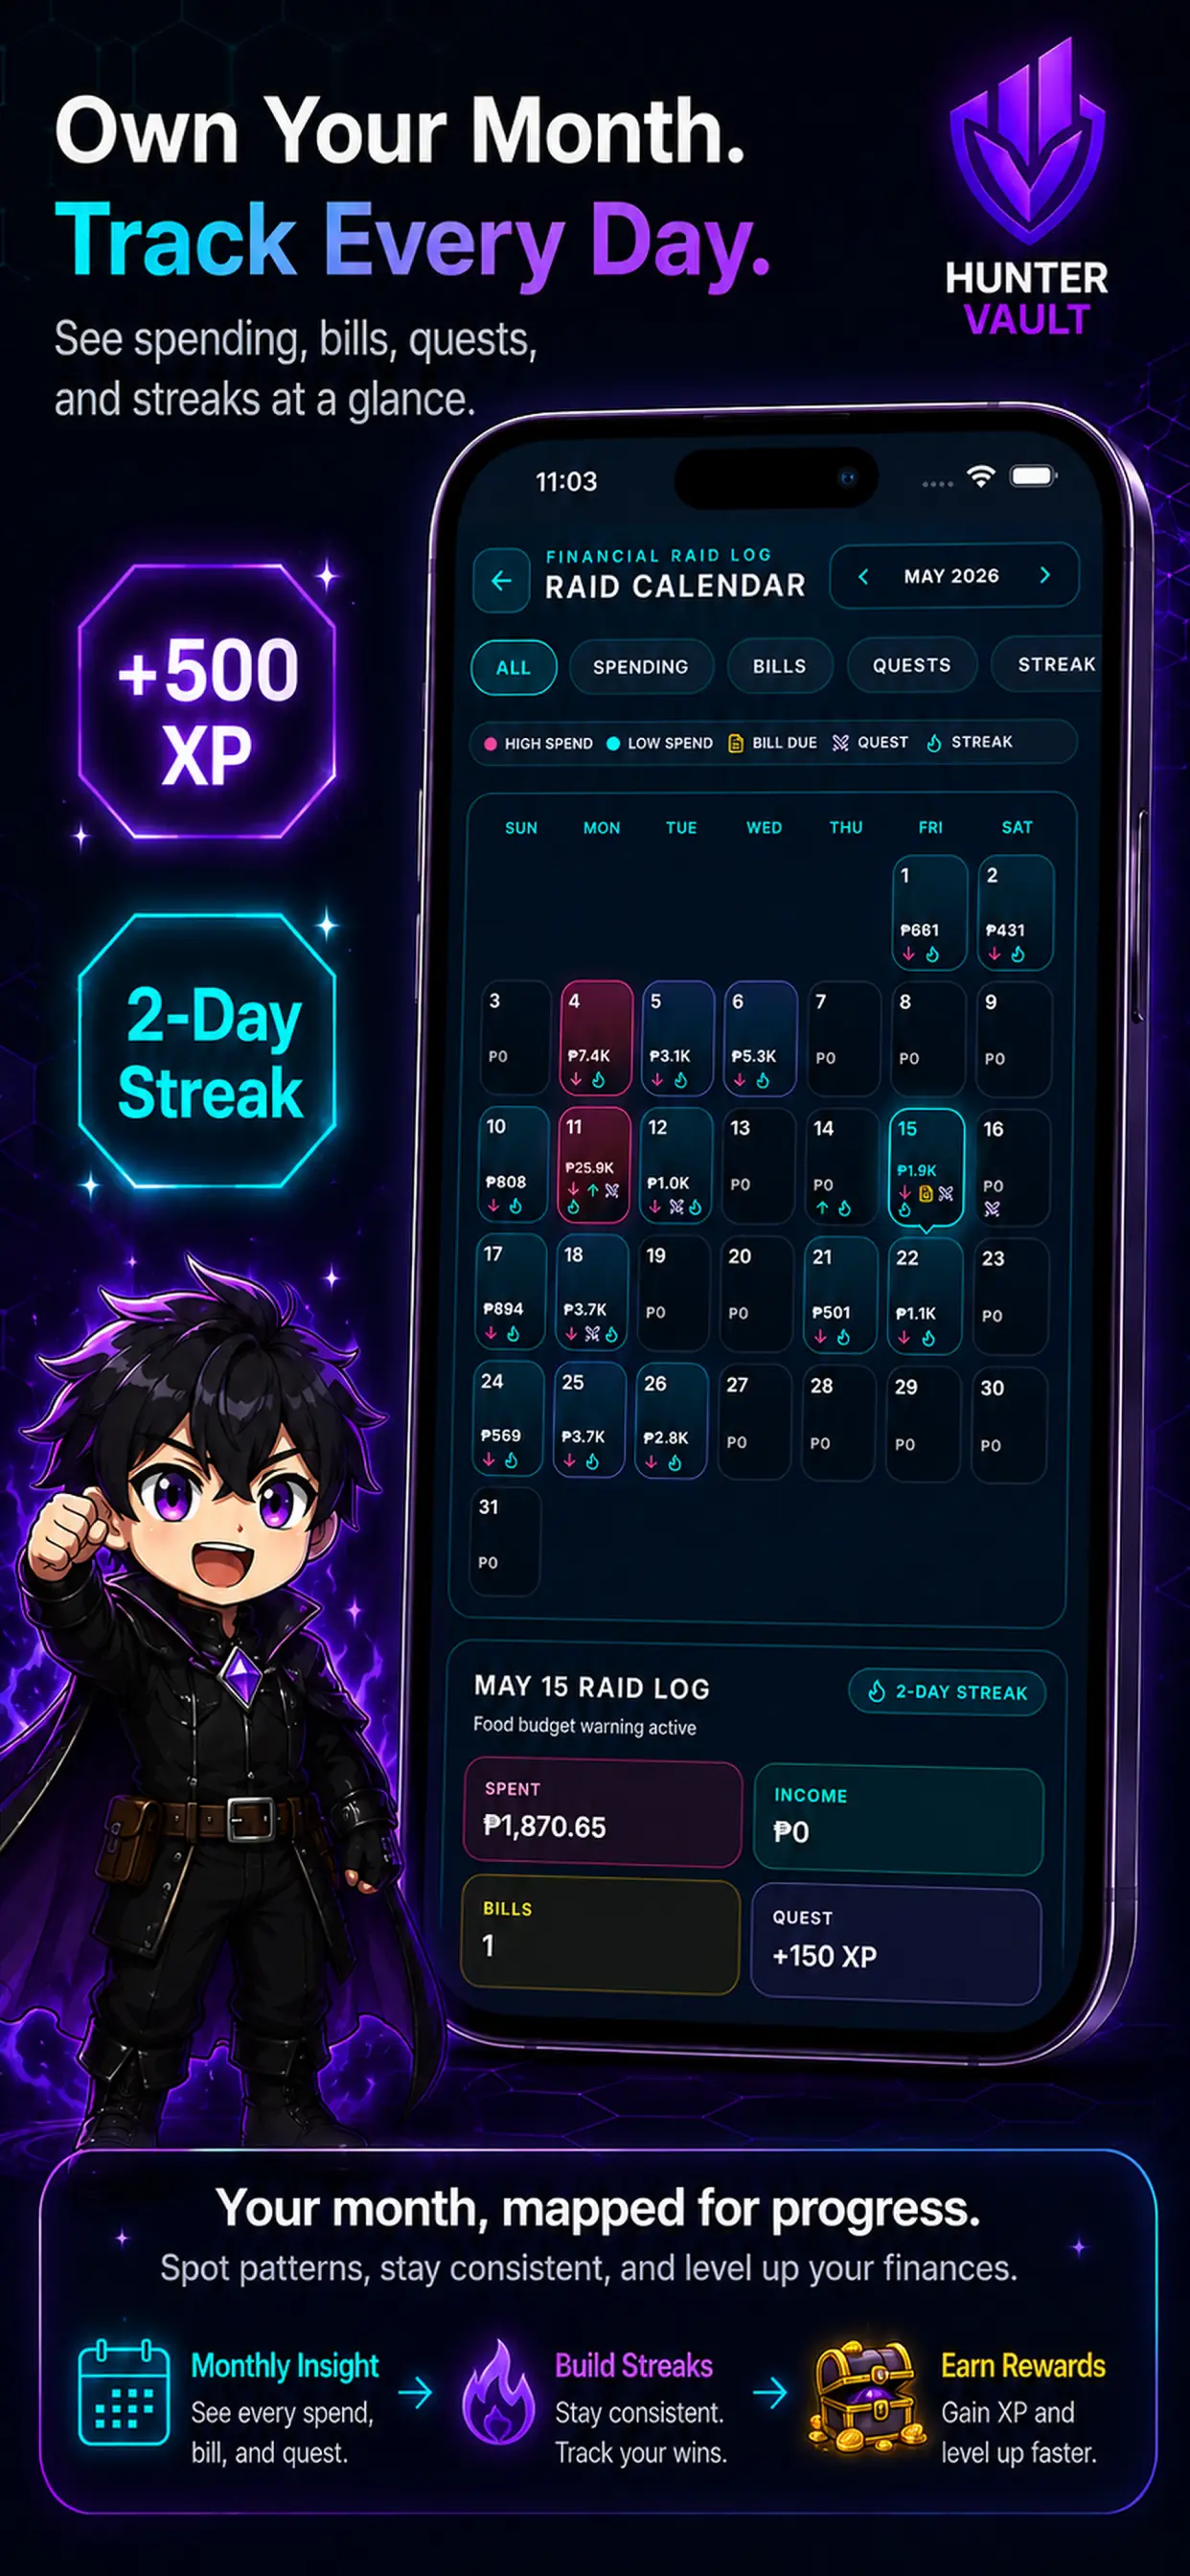
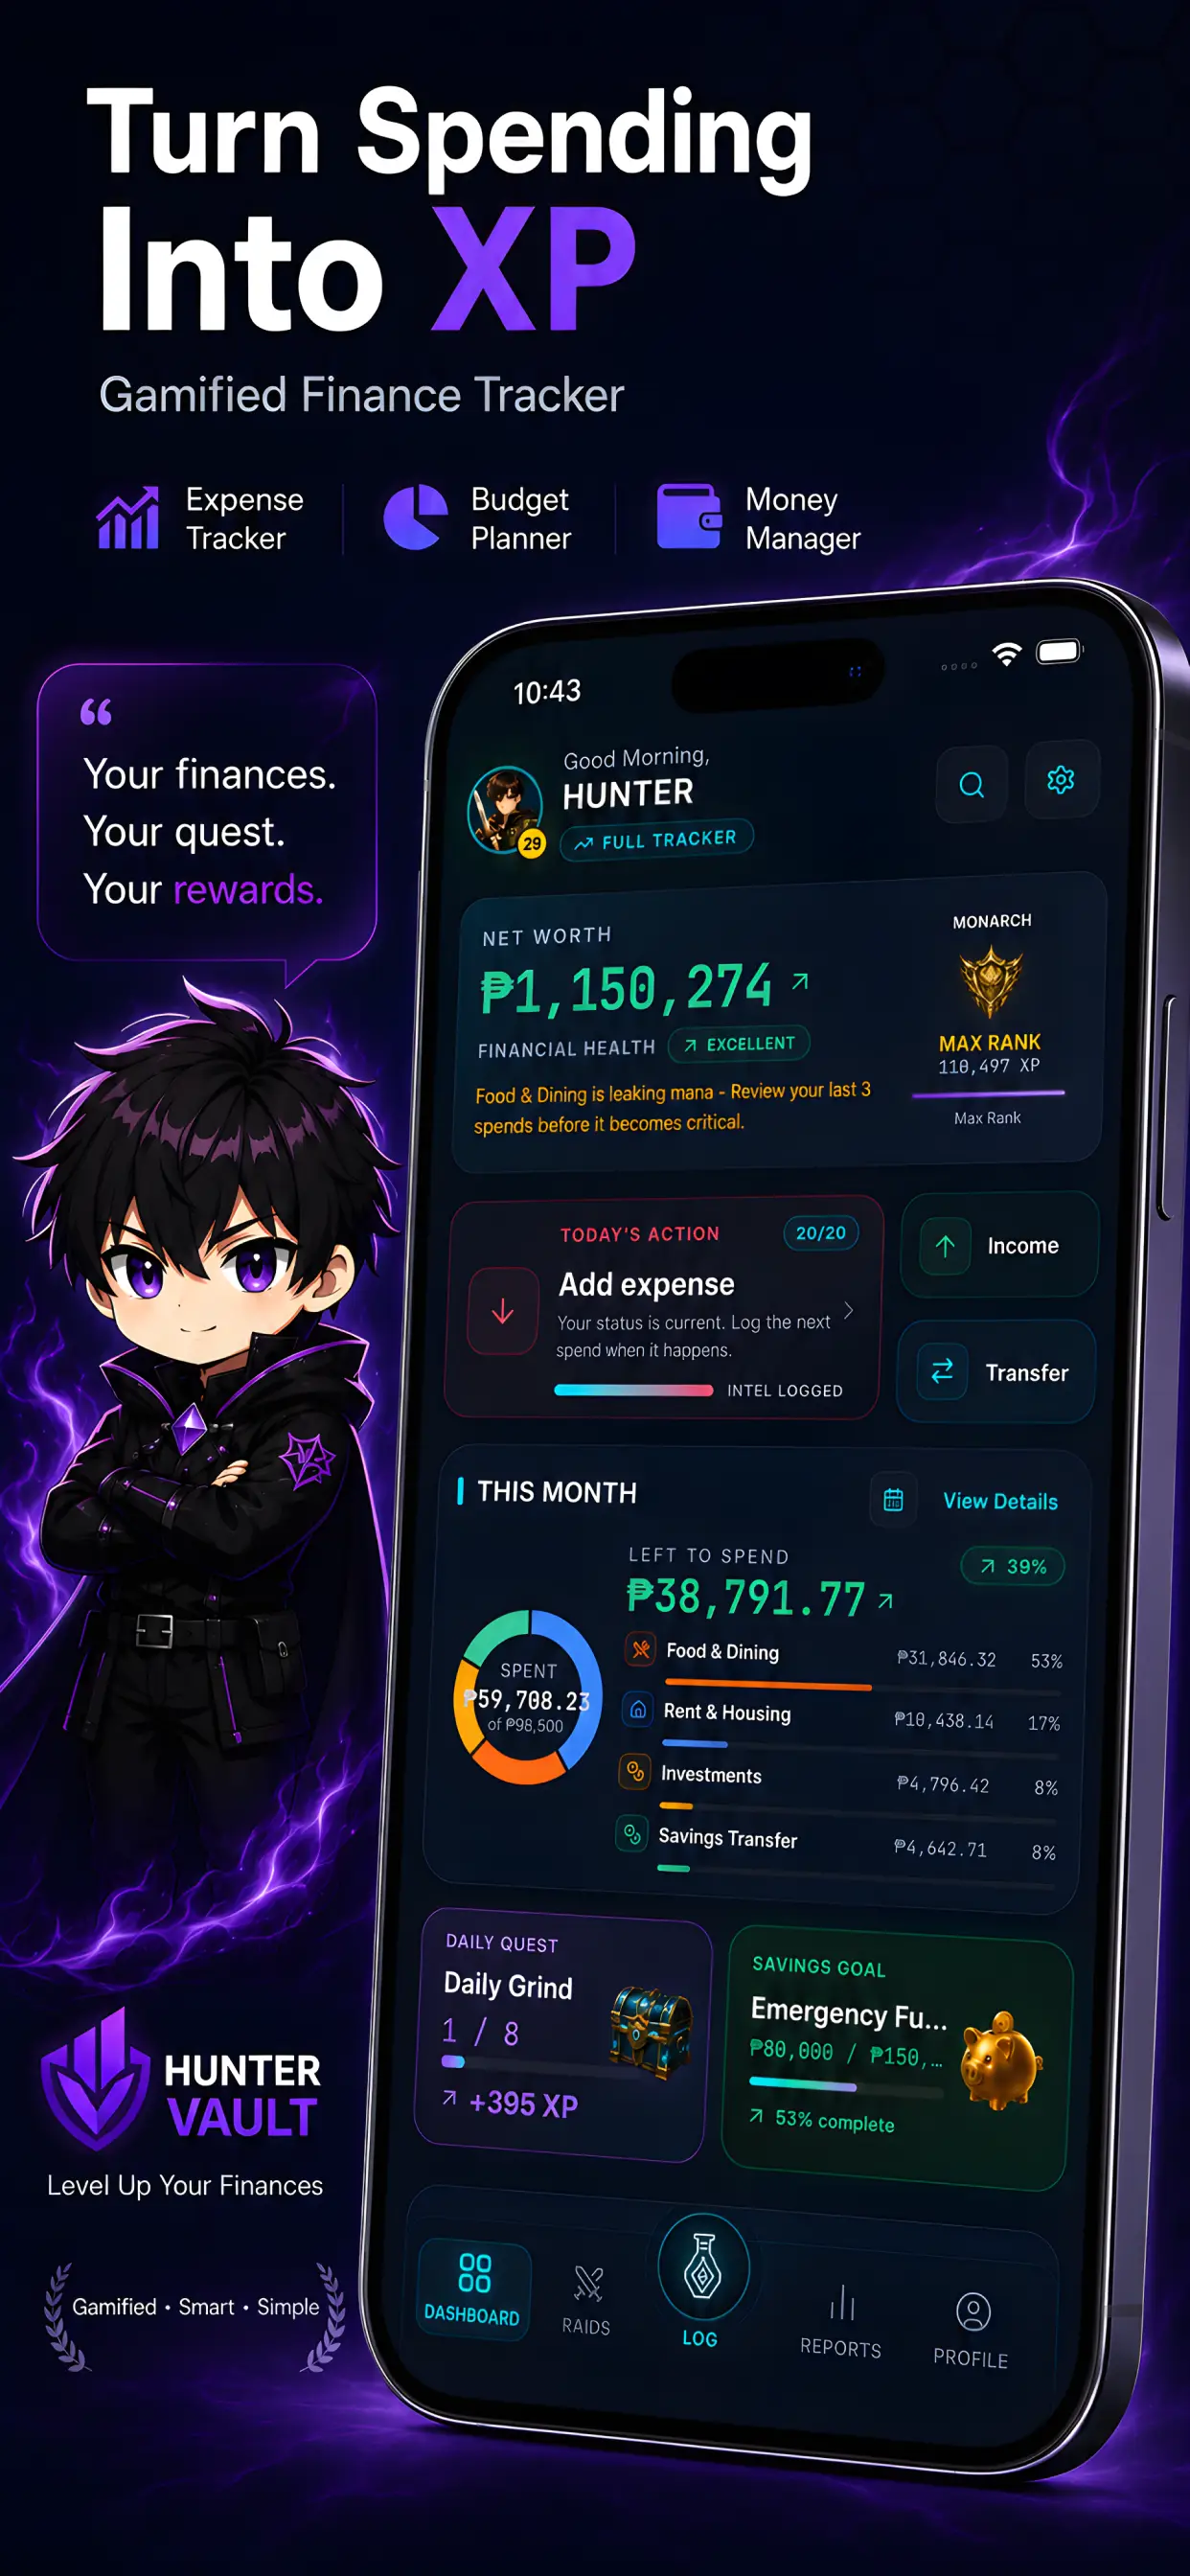
Logging your money is step one. Seeing the pattern is where it clicks. Hunter Vault turns your entries into clear charts and breakdowns, so the numbers stop being a mystery.
- Free to start
- No account needed
- Works offline